
What is On-chain data? How to analyze on-chain data to accompany whales
On-chain data includes information about all the transactions that have occurred on a specific Blockchain network.

Hello everyone,
On-chain data is one of the crucial data that accurately reflects what is happening on the Blockchain network.
Analyzing on-chain data is one of the metrics that provide precise information about the transaction history on the blockchain to bring new ways of thinking for investors in terms of valuation and to understand the actions of other investors in the market that technical analysis cannot get.
In this article, I will guide you on how to read and analyze on-chain data in a straightforward and user-friendly manner. All the data is publicly available and free to use for your convenience.
I'm Neo — Admin — Community Manager of Optimus Finance and Growth Marketing of LECLE Vietnam. Let's get started!
1. What is On-chain Data?
On-chain data includes information about all the transactions that have occurred on a specific Blockchain network. Through this data, the transparency of transactions and the actions of investors in the market are publicly disclosed. It reveals whether investors are taking a profit by selling or accumulating more coins to hold.

All of this information will be recorded on blocks of a Blockchain. The data can be broadly categorized into three distinct types:
Transaction data (sender and receiver addresses, the amount transferred, value, or remaining balance for a specific wallet address).
Block data (information about timestamps, mining fees, and rewards).
Smart contract code.
Anyone who performs an action on the blockchain will have that action verified by nodes, and it will also be updated on the overall Blockchain network. Currently, blockchains are decentralized networks operating on numerous nodes, such as Bitcoin with over 11,000 nodes and Ethereum with over 8,000 nodes, ensuring extensive data sharing. Therefore, no one can manipulate or modify this data source.
Thus, On-chain data represents the most truthful and transparent data.

Analyzing on-chain data is one of the relatively new and entirely different methods of analysis compared to technical analysis. Through this type of analysis, we can examine current and past situations to make informed decisions without relying solely on technical indicators.
Hence, on-chain data is considered the most truthful and transparent data.
For instance, on May 19, 2021, data from the Bitcoin Blockchain showed that there was an unusual surge of over 200,000 BTC being deposited into centralized exchanges. This sudden increase in BTC deposits indicated a high possibility that investors were depositing their BTC to gradually take profits.
As a response to this behavior, the price of BTC dropped from $37,000 to around $29,000.
This example illustrates how the volume of BTC deposits and withdrawals directly affects the price of BTC, and analyzing on-chain data can provide valuable insights into market dynamics without relying on traditional technical indicators.

2. Why is it necessary to analyze On-chain data?
In essence, On-chain analysis enables us to obtain accurate and objective information because blockchain technology is built to prioritize transparency in data. Moreover, information on the blockchain is highly resistant to tampering and intrusion, making it a reliable source of information.
With this information, we can track the behaviors of other players in the market, understanding their specific actions and reactions to price movements. This is particularly useful in monitoring the activities of whales, individuals or entities with substantial financial resources and information that can manipulate the market.
By closely monitoring the actions of whales through On-chain data and making informed decisions, it may help traders to become part of the 'few' who achieve success in the market.

And On-chain is also a tool for analysis that allows us to forecast how the market is unfolding and make investment decisions for each individual.
Charts can be "drawn".
News can be "bought."
But On-chain data cannot be "faked."
3. The platform used for On-chain analysis
Currently, there are several platforms providing On-chain indicators that are easily accessible for investors, such as:
The blockchain's Explorer browsers of those platforms. Example: ETH - Etherscan, BSC - BscScan, SOL - Solscan,...
CryptoQuant, Glassnode: they provide On-chain data for Bitcoin, Ethereum, stablecoins, and some major altcoins...
Whalebot Alert: This is a Telegram bot that alerts strong On-chain fluctuations from whales.
Furthermore, there are several other platforms such as Dappradar, Dune Analytic, IntoTheBlock, Dapp.com, Nansen, Arkham...
I usually use the CryptoQuant platform to track On-chain data on a daily basis and use Glassnode to get weekly On-chain updates. Glassnode provides weekly reports, which I read and refer to expert opinions.
Both CryptoQuant and Glassnode are designed to help us easily aggregate On-chain information, making it more convenient than having to search and monitor the data ourselves.

Of course, each platform will have different methods of data analysis and presentation based on its own analytical processes.
4. Top 5 important on-chain indicators of BTC
CryptoQuant is a Blockchain data solution provider based in Seoul, focusing on Bitcoin, Ethereum, and stablecoins. Its data, available through APIs or directly via Python, R, and Excel, can be categorized into four subsets:
On-chain data
Exchange data
Mining data
Network data
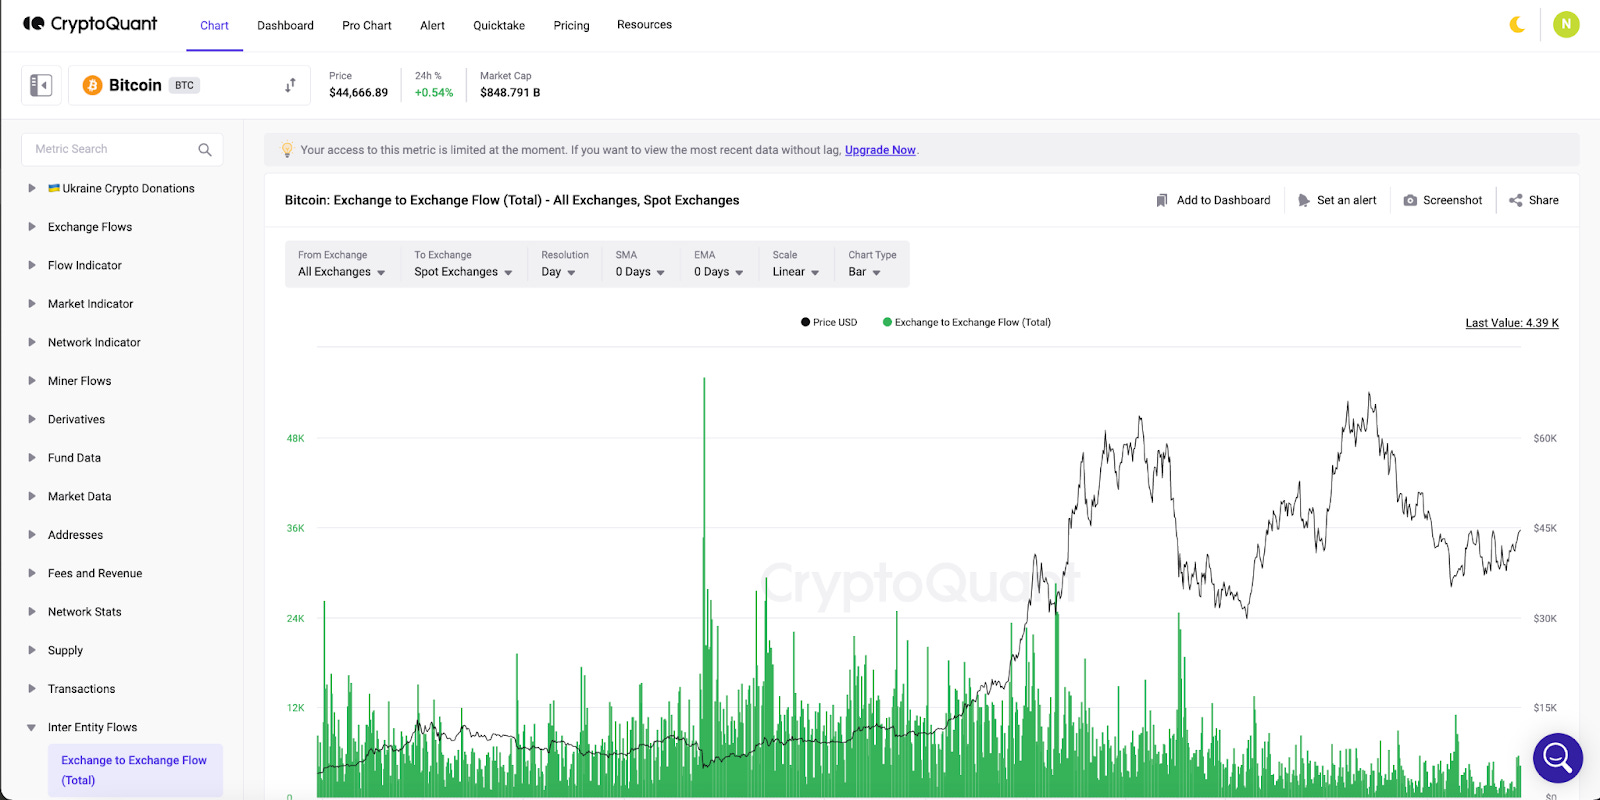
Within CryptoQuant, there are various metrics, such as exchange flow, which refers to the inflow and outflow of funds on different exchanges, including both spot and derivatives exchanges of major platforms like Binance, Okex, FTX, Coinbase, and more.
The Flow Indicator consists of metrics built on on-chain models, used to signal price fluctuations based on BTC's value assessment, enabling investors to trade with confidence.
Market indicators encompass metrics that are mostly related to market data, allowing us to assess the market's trends.
Delving into such categories, I will share with you the prominent indicators that I frequently use on this platform.
4.1. BTC all exchange netflow
BTC all exchange netflow - The index calculates the net inflow or outflow of BTC on exchanges by subtracting the total amount of BTC withdrawn from the total amount deposited during that day or week, indicating whether there is a net withdrawal or net deposit of BTC.
If there is a net deposit, it indicates increasing selling pressure, posing a threat to the price. On the other hand, if there is a net withdrawal, it shows growing investor demand and reduces selling pressure.

4.2. BTC all exchange reserve
The BTC all exchange reserve index represents the total supply of BTC held across all exchanges.
If BTC is consistently being withdrawn, the exchange reserves will decrease, indicating BTC scarcity and potential price increases.
Conversely, if BTC is continuously being deposited, the exchange reserves will increase, suggesting an excess of BTC and signaling a potential price decrease.

4.3. Stablecoin Supply Ratio
Stablecoin Supply Ratio là chỉ số được tình bằng công thức vốn hóa thị trường của BTC chia cho vốn hóa thị trường của tất cả các Stablecoin.
Khi chỉ số này ở mức cao tức là nguồn cung Stablecoin thấp so với giá trị vốn hóa của BTC cho thấy áp lực mua thấp và tiềm ẩn khả năng giảm giá của BTC.
Ngược lại khi chỉ số này thấp, tức là nguồn Stablecoin cao so với vốn hóa BTC và sẽ có áp lực mua tiềm năng từ lượng Stablecoin này, từ đó tiềm năng tăng giá cao.

4.4. Whale ratio
Whale ratio is an indicator related to selling pressure from whale wallet addresses. It is calculated by dividing the total number of Bitcoin deposits on exchanges by the total amount of Bitcoin deposited.
If this ratio increases significantly, it indicates a high influx of BTC being deposited on exchanges, suggesting that whales are actively depositing BTC, which may exert selling pressure and potentially lead to a price decline.

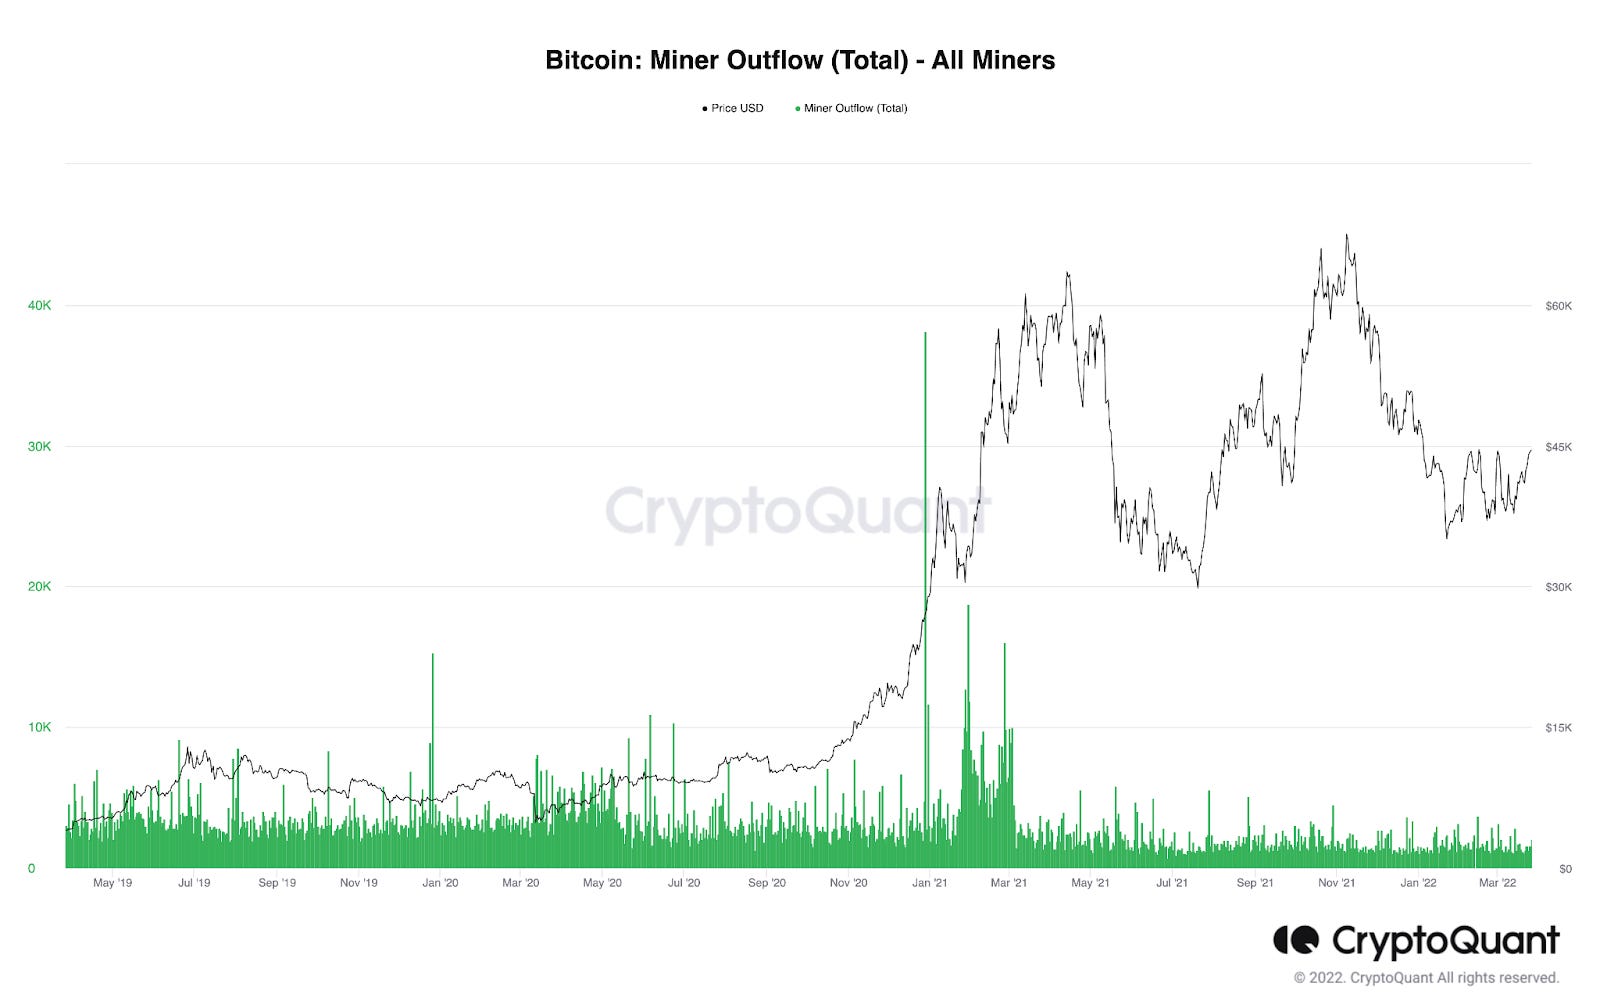
4.5. Miner Outflow
Miner Outflow is an indicator related to BTC miners, as they hold a relatively large amount of BTC.
Miner Outflow represents the amount of BTC transferred out by miner wallets. This can happen when miners send BTC to exchanges for selling, conduct over-the-counter (OTC) trades, or transfer internally between their own wallets. Therefore, we should observe if there is a continuous large outflow of BTC, as it may indicate a gradual selling-off process by miners.
In addition, you can refer to the opinions of experts on Cryptoquant by accessing Quicktake and Glassnode's weekly On-chain reports to review their insights.
However, it's important to note that these opinions are for reference only, and you should maintain an objective view to evaluate the market and make the best decisions.
Large funds like Grayscale should also be of interest, and you can regularly check their holdings and transactions with various altcoins on the Coinglass website.
Furthermore, you can frequently monitor the scarcity-driven model of BTC Stock-to-Flow to understand potential price predictions. This can be calculated based on the expected stock-to-flow ratio, taking into account the approximate mining schedule for future Bitcoin mining.
5. Keynotes for on-chain data analysis
On-chain analysis can be challenging for newcomers and requires perseverance in research. Accumulating sufficient knowledge and experience will provide multidimensional perspectives to accurately evaluate and anticipate the information gathered.
Currently, there are numerous platforms offering on-chain data, and some may provide inaccurate figures. Therefore, it's crucial to assess and cross-reference information from multiple sources for the most precise evaluation.
Relying solely on on-chain data from projects should be avoided. Projects may release non-standardized data as part of their marketing efforts, so it's essential to cross-check the information on the respective DApp blockchain explorers.
Regular updates are essential for on-chain analysis, as the market is constantly changing, especially in the highly volatile Crypto market compared to other financial markets.
6. Closing thoughts
On-chain data is a powerful tool and a valuable ally for investors in making their investment decisions. However, it is a tool that demands users to possess certain knowledge and analytical experience to use it effectively.
What about your thoughts? Don’t hesitate to share with us! 😀
This post is for educational purposes only. All materials I used were the different reference sources. Hope you like and follow us and feel free to reach out to us if there is an exchange of information. Cheers! 🍻
#onchaindata #cryptoquant